
The bottom of the office market is finally here. It’s been six and a half years since Covid began, and over that time, approximately 90% of all office tenants have had their leases expire or be restructured, giving them the chance to right-size based on their remote and hybrid policies. The chart below comparing January 2025 to present shows that no U.S. office market has seen a meaningful increase in availability. While most metro areas are statistically unchanged and have hit equilibrium, a handful of markets have seen a significant decline in availability rates over this two-year horizon.
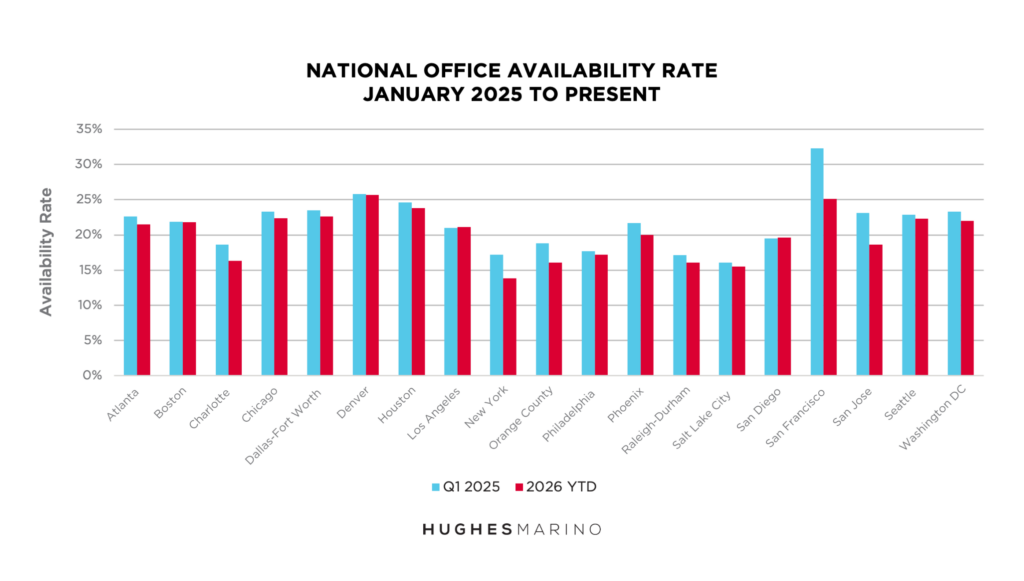
The most dramatic change is in San Francisco, where availability rates were 32% just two years ago and are 25% today. This 7-percentage-point decline in availability is driven mostly by job creation at technology and AI companies in the city. However, landlords and their brokers have used this momentum to stir up the market and act as if there has been a full-blown recovery. Even though San Francisco’s availability rate remains one of the highest in the country, there is no fundamental economic basis for landlords to raise rates. Still, landlords, in lockstep with their brokers, have created a narrative that tenants had better act fast and that there’s tenant competition for space, even though leasing activity is beginning to slow.
New York City has experienced a 3.4-percentage-point decline in availability attributable to technology job creation and corporations enforcing return-to-work policies, in many cases bringing office attendance close to pre-Covid levels. Other markets benefiting from growth in the technology, financial services and business services industries include San Jose, Orange County and Charlotte, with availability declines of 4.5, 2.7 and 2.3 percentage points, respectively. These five markets are outperforming their national peers, which have largely bottomed out and reached equilibrium.
One of the biggest stories in the national office markets is the normalization of sublease inventory. After growing from 132M SF in the second quarter of 2020 to a peak of almost double that at 251M SF in the second quarter of 2023, sublease inventory has gradually declined quarter over quarter for more than three years, drifting down toward pre-Covid levels. The reasons for this decline are threefold. First, with the passing of time, many sublease listings have simply come off the market as the underlying leases expired. Second, as companies looked for value ahead of returning to the office in 2023 and 2024, many opted for plug-and-play subleases priced 20% to 30% below market. Third, with so many companies now occupying their space and growing back into it, there’s very little new sublease inventory coming onto the market.
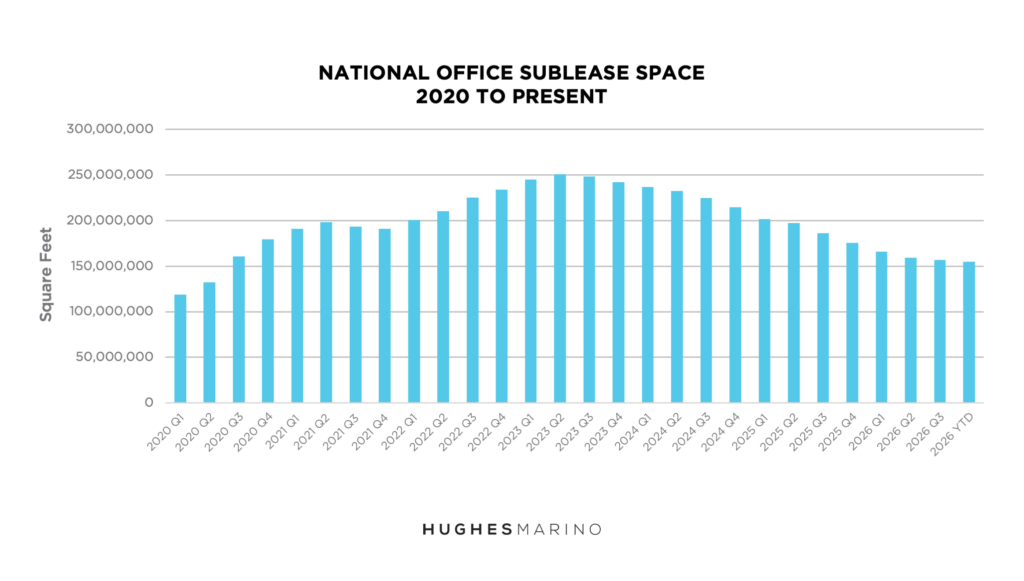
The chart above shows the rapid rise in sublease space during the first couple of years post-Covid and the almost straight-line decline ever since the 2023 peak. Barring an economic shock, national sublease inventory should continue its steady decline through 2027.
While the worst is behind office building owners, availability rates that still hover around 20% in many major markets mean the struggle isn’t over. The major national office markets have hit their new normal, and today’s rents and concessions are likely to persist for the foreseeable future. Hughes Marino has been successful with proactive lease renewals and creative lease restructuring for leases with two to three years of term remaining, as savvy landlords don’t expect a rapid recovery anytime soon and are willing to get aggressive to lock in good tenants. The good news for tenants is that favorable conditions should hold for at least the next couple of years.
Market statistics provided by CoStar Group.