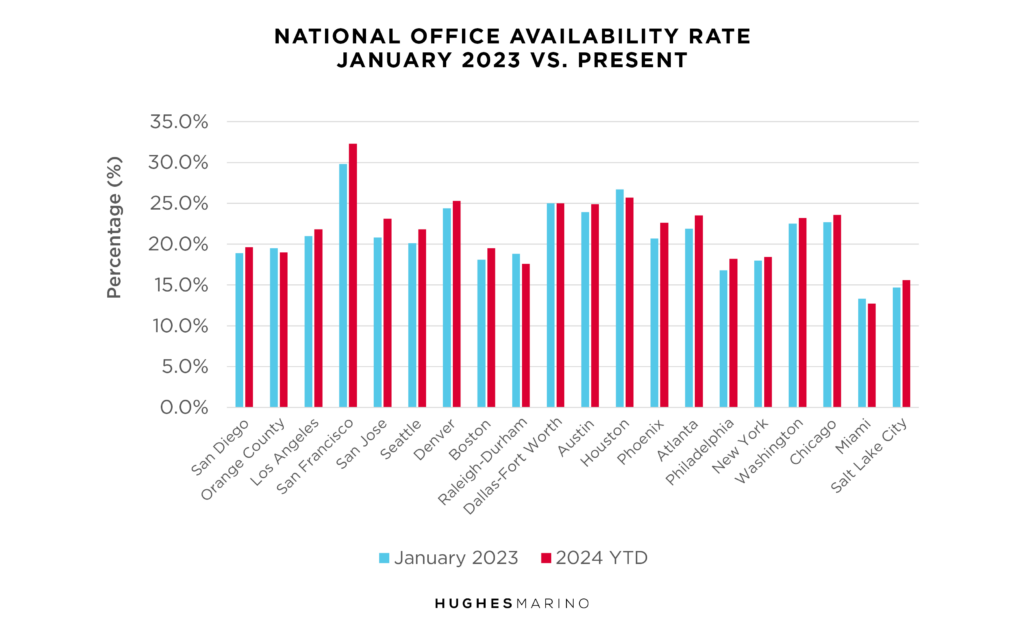
While this title seems like a bold assertion, everyone is waking up to the reality that the office markets around the United States are in freefall. Consider this graph that compares January 2023 availability rates of U.S. office space to today. Nearly every metro area has crested 20%… or is well on the way… with Denver and the Texas markets of Dallas, Houston and Austin all at 25%, and San Francisco in the lead at almost 33%. Never in history has there been a bigger fall from grace than the story of Downtown San Francisco office real estate, having gone from one of the most expensive and tightest markets in the United States, to now by far the softest. Meanwhile, Miami is uniquely beating all the odds, and a full five percentage points below the next softest market.

The key consideration is year-over-year change. While there are some marginal bright spots in smaller markets like Orange County and Raleigh-Durham, virtually every other major metro market still had a 1%-2% increase in availability over the last year, and San Jose and San Francisco went up almost 3%. To the casual observer, that might sound insignificant, but consider that half of all U.S. office leases have yet to expire. Pre-Covid, the tightened markets in most major metro areas required office tenants to sign 7-10-year leases. Some of the biggest office leases in the tightest markets like New York City, Chicago and San Francisco were 11-15 years in length.
Shedding of Office Space Will Continue for Years
We are now at the four-year anniversary of Covid, and most companies have fully realized how they are going to operate their office space for the foreseeable future, whether they have a formal policy or not. Generally, the employees that are going to come back are back, in whatever form that is, and it appears that most management and employees have sunk into a new normal, whereby 20%-60% of the office space being used by many companies is sitting idle. As the remainder of these office leases expire, companies will continue to downsize in place or move to smaller spaces, resulting in another 4-5 years of office space shedding through 2028-2029. Framed like that, another 4-5 years of 1%-2% annual increases in availability rates puts markets that are 20% available today up at 25%-30%… markets that are 25% today become 30%-35%… San Francisco becomes 45%, more or less. No one is talking about this very grim reality, as it’s never happened before, and no one has a historic precedent for it. Other than for a long protracted downwards slide in rents that benefit the commercial real estate tenant, the negative effect on regional banks, building owners, pension funds, insurance companies and the tax base is going to be severe.
While we have seen cycles before in our lifetimes with the 1990’s S&L crisis, the 2000 dot-com bust and the 2008 financial crisis, this time is different, as it’s not a “cycle” at all, but rather is a complete reconsideration of how companies and employees use and value office space. But it’s more than that, as the office isn’t inherently bad in most cases—far from it! It’s about the time and cost of the many hours spent each week by people commuting to the office itself, the nature of how and when people work, and the quality of life byproducts for those that are participating in remote and hybrid working.
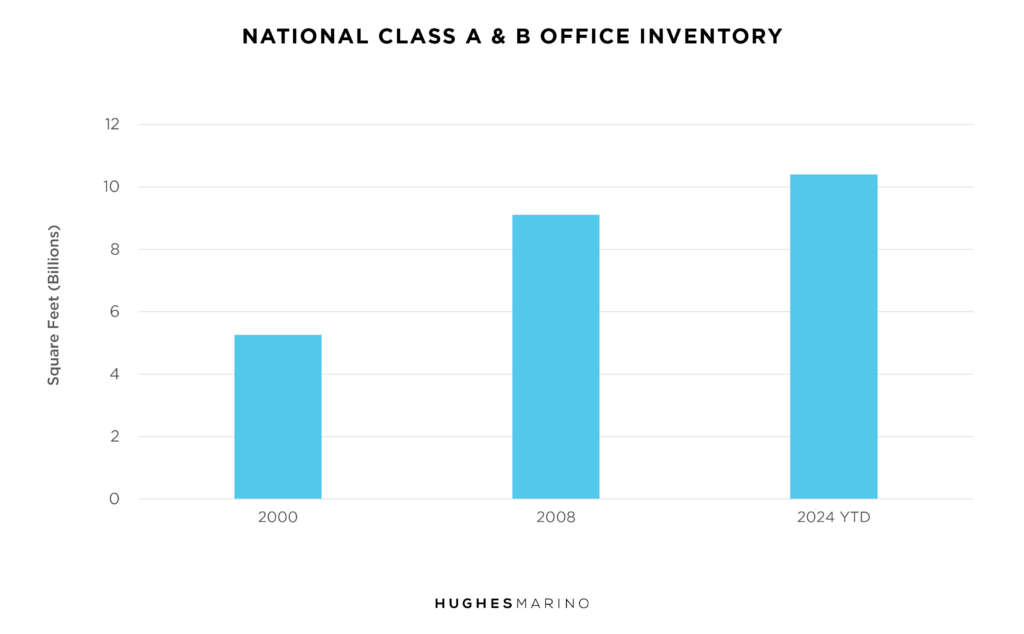
Now let’s take a minute to look back at the prior market cycles referred above, as it’s useful in this future assessment to understand that the square footage base of office real estate today is also much greater than ever before. The chart below shows how much total Class A and Class B office space existed at specific periods of time as compared to today.

While there were moments in history where some office markets had up to 20% availability or more, the size of the U.S. office market today is double the size as it was in 2000. When comparing the same percentage measurements over time, if what we are analyzing is bigger today, the raw number itself is now much greater. For example, 20% market availability in year 2000 results in 1B square feet on the market for lease or sublease, while 20% in 2024 means that there are 2B square feet on the market—double the actual square footage of space. Today, major metro office markets are staggering in their relative historic softness in percentages AND real numbers.
How to Properly Leverage the Extended Tenants’ Market
So how can you as a business owner, real estate executive or management team member take advantage of this extended tenants’ market? The reality is that you don’t have to worry about timing the market—it’s going to be soft for years to come (of course there are always geographic submarket exceptions). Your window is WIDE OPEN! But on the way down, it’s going to be a very inefficient opaque market for tenants, with a lot of deceptors—landlords and the brokers that represent them to name a few. With the exception of a handful of metro areas, landlords across the U.S. still have the same asking rents as they had pre-Covid, and some with Class A properties have even raised them! The reports from the conflicted full-service brokerage firms that promote the owners’ prices are muddy at best, some forecasting a recovery for various ill-substantiated reasons. If you are a tenant wanting the best space at the best financial terms and conditions possible, then get representation that has a vision for the future that isn’t rooted in boosterism for landlords, and is ready to work for your bottom line as a tenant representative.
Marketing statistics provided by CoStar Group.


