The Trend
While all the national news has focused on the glut of office space resulting from remote and hybrid working, the commercial real estate industry has been noticeably quiet about the state of affairs for the industrial market. The industrial markets throughout the United States have shifted in 2023 and are not as tight as landlords and the full service brokerage community would like you to believe.
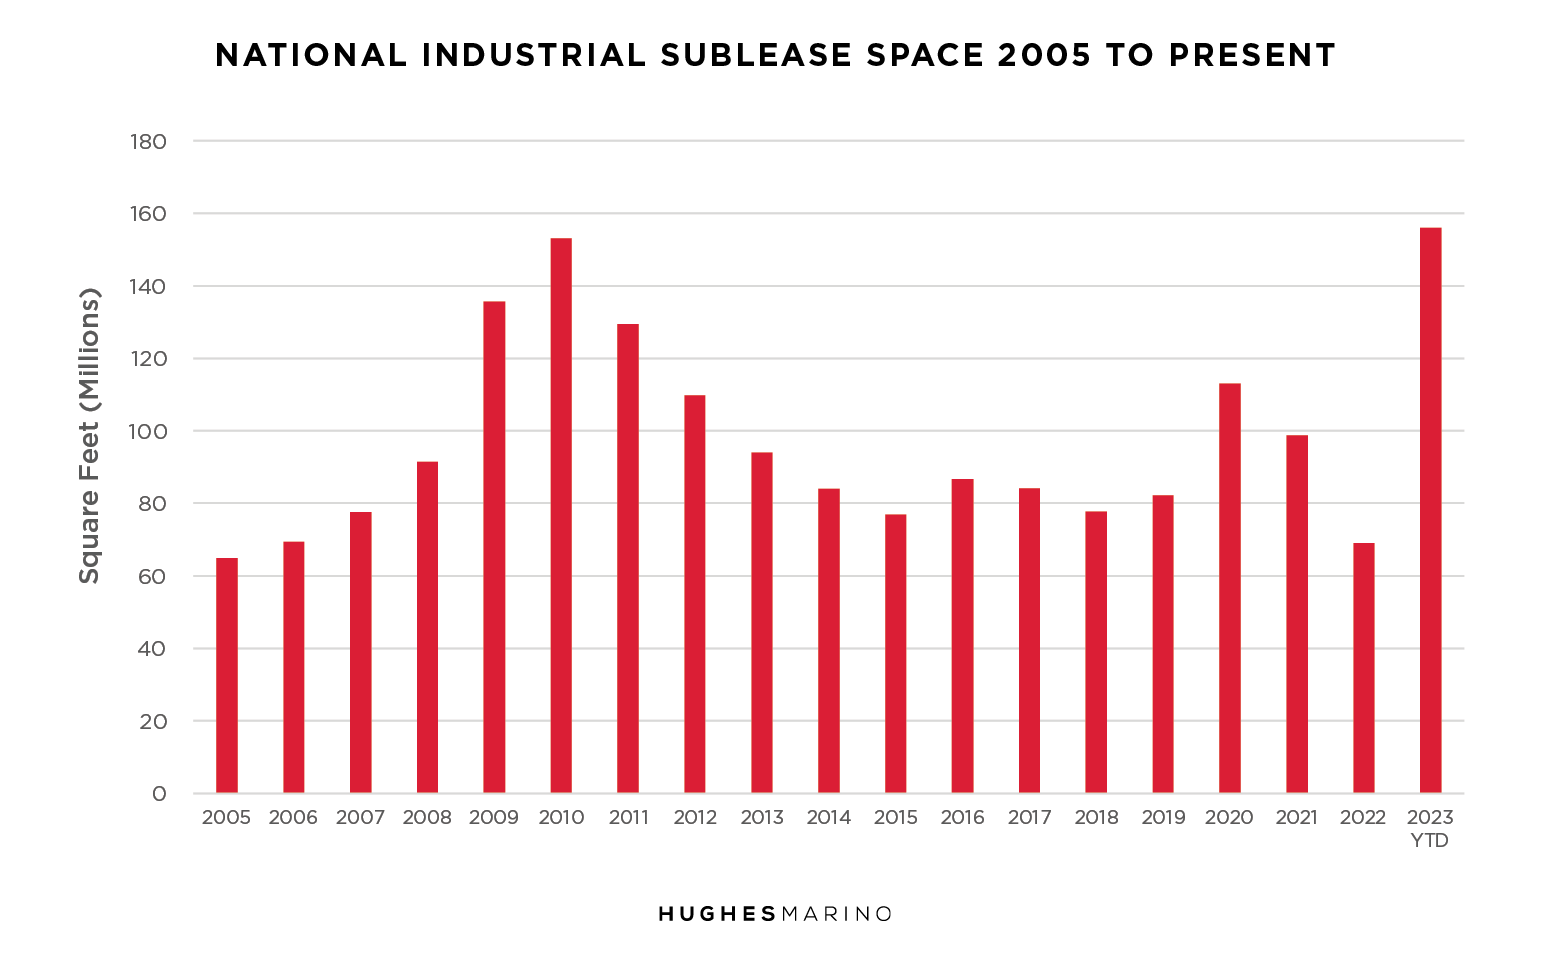
A leading indicator of the health of the commercial real estate market is the amount of sublease space on the market, as that tells you how Corporate America is behaving relative to their current occupancy requirements. Shockingly, the total amount of sublease space on the market throughout the United States is at a level not seen since 2010 as shown on the chart below, totaling 156M SF today—doubling in the last year. E-commerce companies are trying to unload space that they committed to back during the feeding frenzy in 2021 and 2022, where big e-commerce companies had an insatiable appetite for expansion space, particularly in buildings over 100,000 SF. Now those same companies are going through a cooling off and rationalization around these over commitments, sliding more and more buildings on the market for sublease throughout 2023.

Key Market Nuances
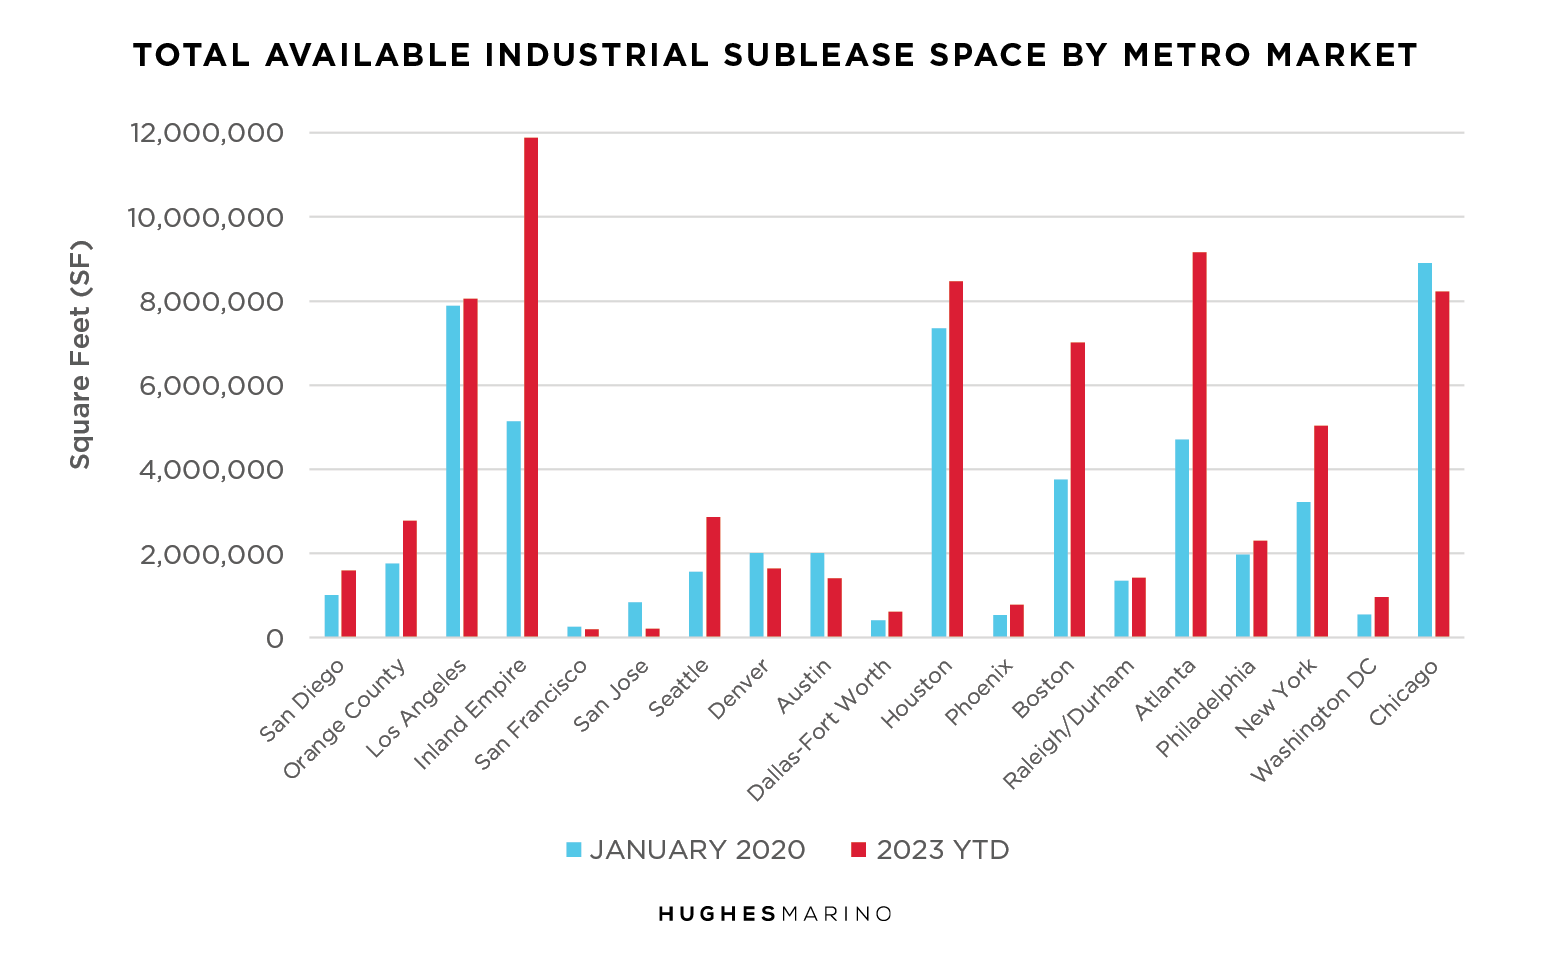
To further dissect this macroeconomic trend, it’s useful to look at each major metro market to understand how concentrated these sublease opportunities are. 34% of all of the sublease space in the entire United States is concentrated in the six major markets of Los Angeles and the Inland Empire in Southern California, Dallas/Fort Worth and Houston in Texas, Atlanta and Chicago. In 2022, most of these markets had cut sublease inventory in half from the pre-COVID conditions, and this spiking has all occurred in the last year. What is so startling about the Inland Empire, Houston and Atlanta is that total sublease inventory for industrial space has doubled as compared to pre-COVID conditions. We’re talking about surge conditions.

Availability vs Vacancy
Increases in sublease inventory are always the leading edge of a softening market. This increase in sublease inventory is also a landlord’s worst nightmare as landlords and their promoting full-service dual agent brokers try to collectively keep a floor on prices. The reality is that there are major cracks in the dam, and that tenants in some markets today can get better deals on subleases than they’ll ever get from landlords—often with the space being delivered with racking and technology infrastructure in place, potentially saving tenants hundreds of thousands, if not millions of dollars to fit up a new facility.
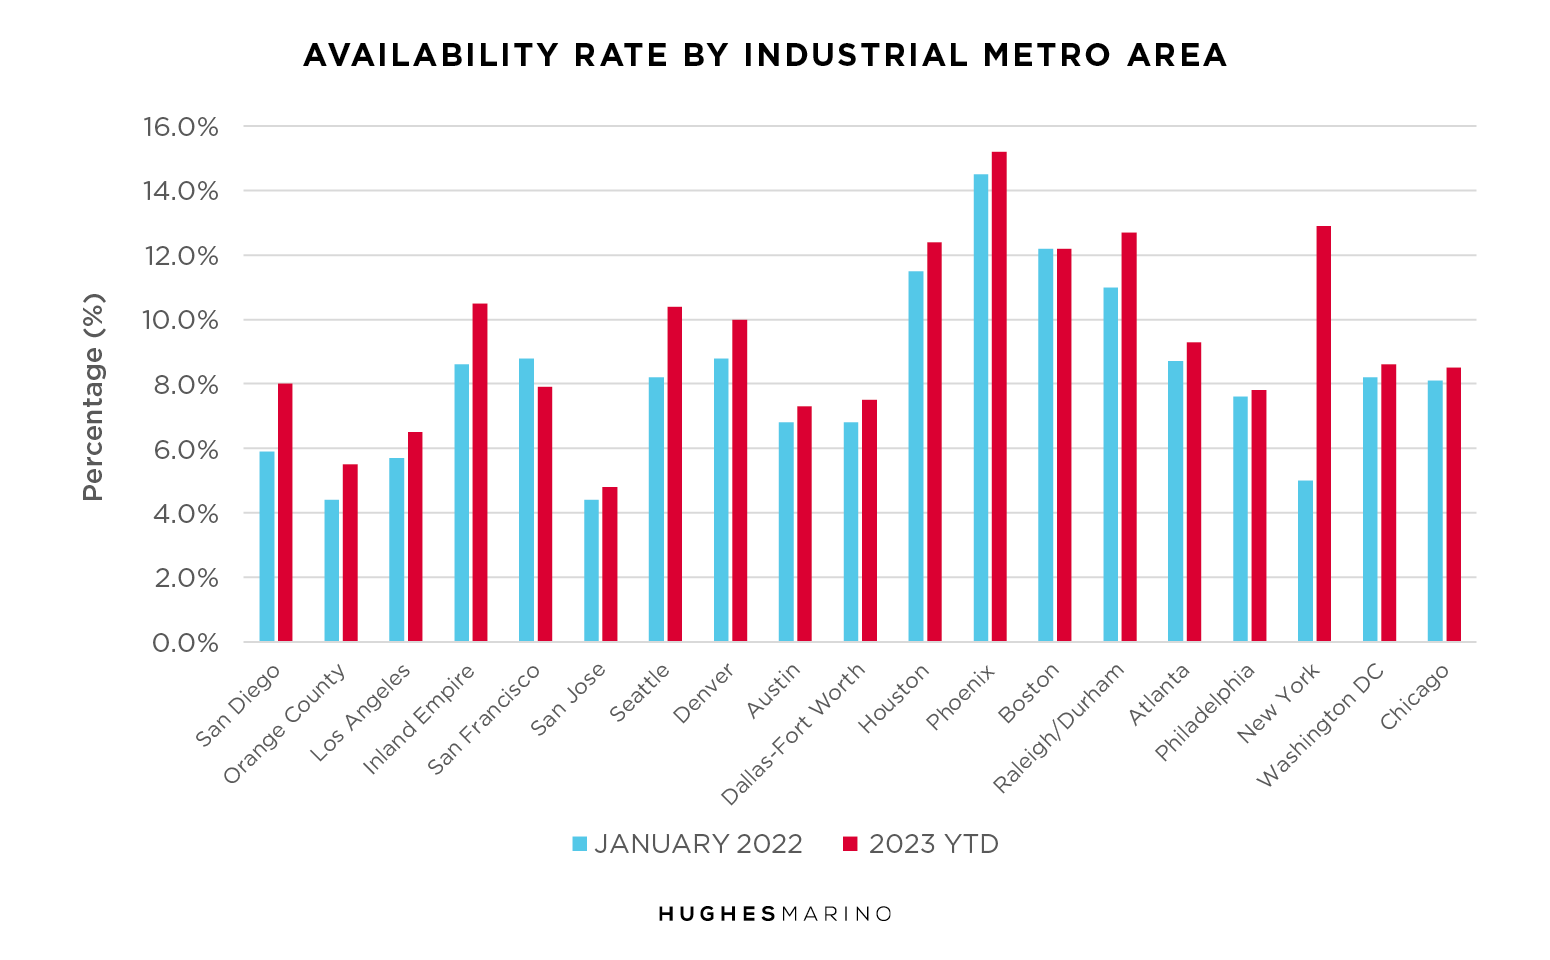
This sublease inventory has influenced overall availability rates as well. Note that we are measuring “availability” not “vacancy.” Availability captures all of the collective space that’s on the market for lease and sublease in existing buildings, as well as those under construction, whereas “vacancy” measures only space for lease or sublease that is “vacant” in existing buildings. The brokerage industry considers most of the 156M SF of sublease space as not vacant, and when you add in another 558M SF under construction around the country that is not captured in “vacancy,” it’s easy to understand how overstated the health of the market is when commercial real estate agents start talking around vacancy statistics—the conventional measure of the strength of the commercial market.
When you think critically, “vacancy” as used by landlords and their brokers looking to prop up the market, is a gross mismeasurement of the available space market. When a tenant is looking to lease space, they don’t just look at vacant space—they look at all space that meets their requirements, whether for sublease, lease, in existing buildings or those under construction.

The Demand Curve
If you are a business owner, executive team member or corporate real estate executive that leased industrial space in 2021 and 2022, you obviously felt the effects of a hyper-inflating rental market that was driven by historically unprecedented demand from e-commerce and other supply chain related companies. Southern California markets saw some of the highest rental rates in the country where lease rates in 2022 peaked from $1.75 to $2 triple net. These high prices were caused by the fundamental interaction of supply and demand where there were literal bidding wars by tenants over new warehouse buildings—new buildings were often pre-leased before they broke ground. Demand was so frothy in 2021 and 2022 that landlords could not build buildings fast enough for the exploding flow of products and materials coming in through the ports of Long Beach and Los Angeles to support e-commerce demand resulting from the 2020 COVID shutdown—but all that is over.
While this extreme demand caused availability rates to fall to the low- to mid-single digits in 2022 in most metro areas, all markets have rebounded now in 2023, where availability rates are back to their pre-COVID levels. In the Inland Empire, Seattle, Denver, Austin and New York, availability rates are materially higher than their pre-COVID levels, yet landlords and the brokerage community are still trying to charge 2022 prices because they are still anchored on vacancy rates and have groupthink around the belief that the market is tighter than it actually is. These gains in the market are not going to be given away easily, and that is where we come in.
Becoming The Market Maker
The truth is that these industrial markets are changing in real time, and there is no longer any basis in the supply and demand equation for any more inflation of rents. In fact, the opposite should be occurring by 2024, as landlords find themselves sitting on their empty building for more than a year and look for an explanation. Rents in these major metro areas with more than 10% availability will start trending back down, and we are already seeing signs of it. Tenants today must be cautious in how and when they engage the market, particularly when talking directly to their landlord or working through their dual agent listing broker on a renewal. They are not going to understand how robust their options today really are, and what deals someone else is really willing to do. Doing the hard work of going to market and establishing your value is essential to becoming a market maker, and not a market taker.
Market statistics provided by CoStar Group.


