Welcome to March of 2024, four years post-Covid. No longer are the ecommerce companies gobbling up hundreds of millions of square feet a year like they did in 2021 and 2022. No longer is the supply chain stuffed with raw materials and goods to satisfy a seemingly insatiable consumer demand. No longer are construction materials overflowing in warehouses stuffed for new construction and remodeling. In fact, in lieu of the hyper-growth the industrial real estate market experienced from 2020-2022, a full reversal is in the making. Industrial companies that over-committed to space during that run up are dumping space for sublease like we haven’t seen ever in history.

A Record Supply of Industrial Sublease Space
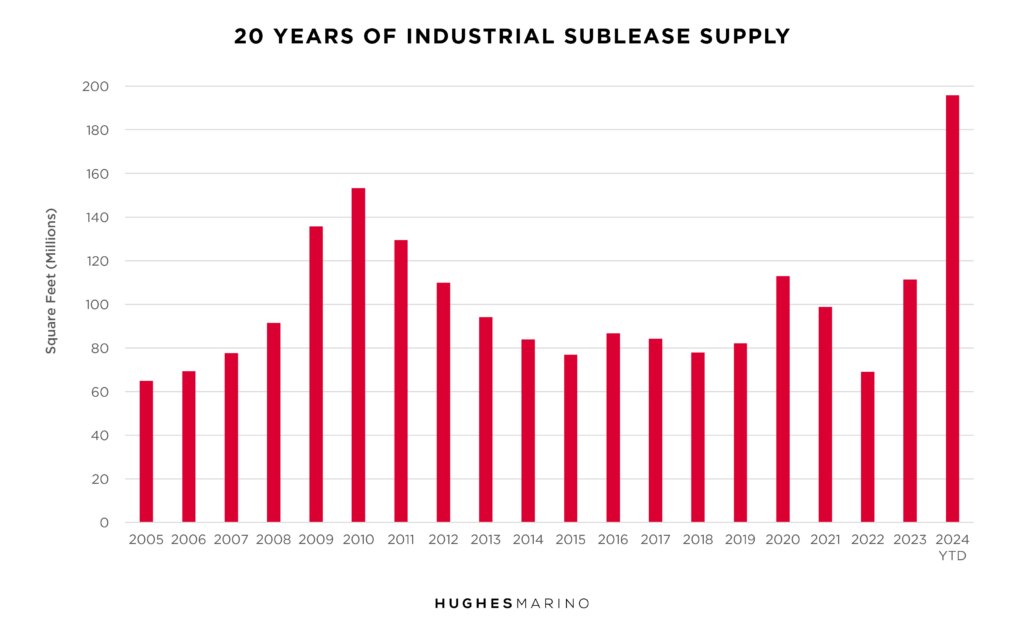
Today there is 196M square feet of industrial space on the market for sublease, a record high. All of this is offered at discounts to market, and much of it fully equipped and racked. Just to put this in perspective, there is 246M square feet of office space on the market for sublease in the U.S., down slightly from 2023 as leases expire and subleases roll off the market, and all pundits are forecasting the end of days for office space.
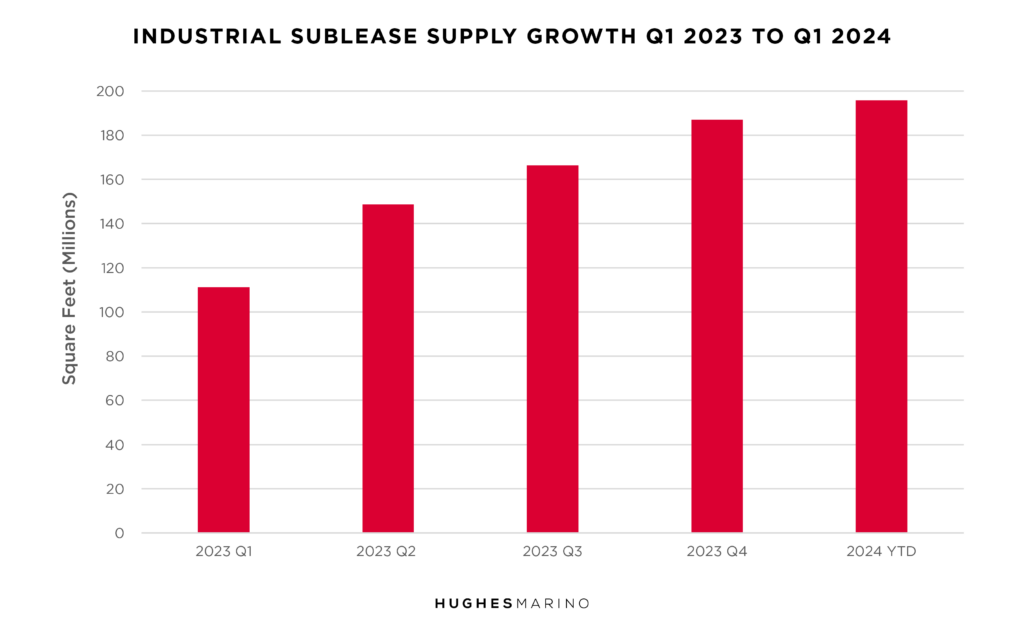
After a sublease supply jump from 2022 to 2023, never in history has the U.S. market seen such a spike in industrial sublease supply that subsequently occurred from 2023 to 2024. Growing at just over 21M square feet a quarter, this graph below shows that extreme and unprecedented escalation of industrial sublease space.

Such supply spikes in any asset class have always been a “canary in the coal mine” for a softening of that asset class, as it signals a dramatic and sudden shift in the demand side of the real estate equation.
However, this spike in sublease supply is just part of the post-Covid narrative. Real estate developers thought the 2020-2022 demand would last forever, and classically overbuilt the market, thinking that demand continues in straight lines versus moving in cycles. As with prior downturns, much of the overbuilding was caused by developers not wanting to miss the demand window, so they jumped into the frenzy to beat other competitors to market. Developers in 2022 built for the 2022 demand and delivered 771M square feet of new industrial buildings in 2023, 48% of which is still for lease today. Now in 2024, another 609M square feet of industrial is under construction, little of it leased.
This flood of both sublease space and new construction—along with space coming back to market as some tenants begin to downsize when leases expire or let leases lapse—has brought market availability conditions back to pre-Covid levels in most U.S. metro areas.

Sublease Availability on the Rise
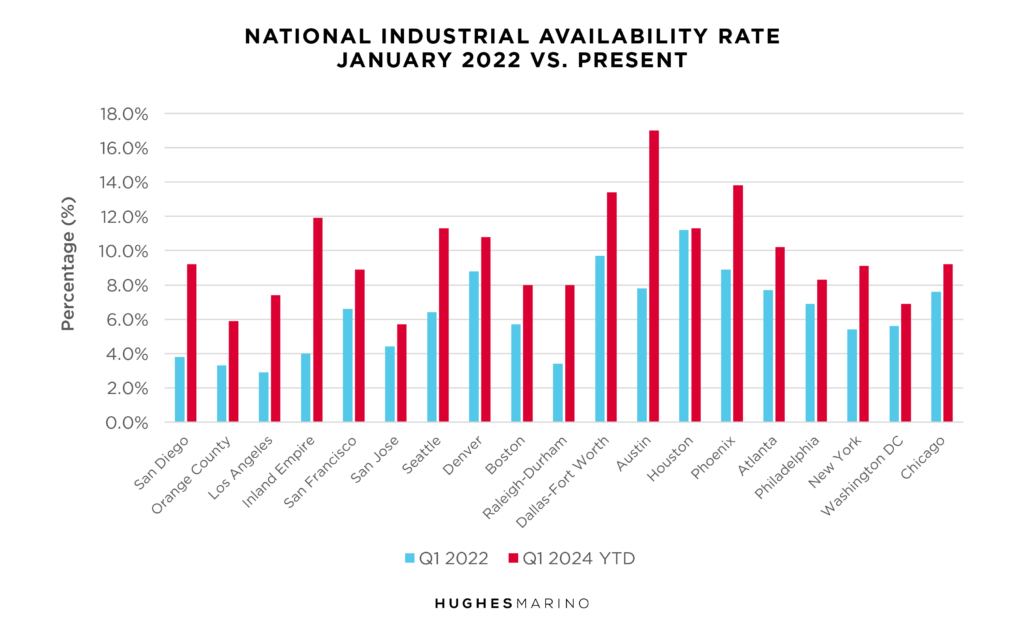
The chart shows that every U.S. market, other than Houston, has had a massive uptick in availability rates over the last two years whereby most have returned to pre-Covid availability rates. Some markets like Austin, Raleigh-Durham, San Diego and Los Angeles have more than doubled in the last two years. The hyper-inflated Inland Empire market of Southern California, where rents doubled during Covid, has tripled. Many metro areas have drifted above the 10% availability line, where historically the market is no longer landlord favorable, and several other metro areas are well on their way!
How to Properly Leverage the Current Market
While this has occurred, asking rents for industrial space across the U.S. remain unchanged. A business owner or executive running an industrial company would naturally wonder how availability rates have gone back to pre-Covid levels, yet market rents have not changed back to those same levels. The reality is that landlords and their conflicted brokers that promote the owners’ listings don’t want tenants to know about any of this, and we are sure you are reading it here for the first time. Landlords work cooperatively to set prices and the brokerage community—as the landlords’ outsourced sales and marketing teams—work to price support the marching orders from their landlord core customers.
The fact is that the industrial markets across the U.S. have dramatically weakened over the last year, and conditions are bound to get worse for landlords. While it’s not a tenant’s market, the leverage that a tenant can generate with the right representation and real estate strategy is better than it’s been in four years. Working with a tenant advocate that understands this shift and how to exploit this change in the market is critical, and the full-service brokers working on their dual agent platforms have a busted model for supporting tenants in this regard.
Marketing statistics provided by CoStar Group.


