
SUBLEASE AVAILABILITY SOARS TO A RECORD 20.5M SQUARE FEET
Industrial sublease availability in the Inland Empire has surged dramatically over the past year, reaching record levels in recent months. In just the past six months, available sublease space has increased by 27.3%, adding over five million square feet to reach more than 20.5 million square feet—the highest amount on record. This surge in available sublease space has contributed a massive opportunity for occupiers considering renewal, flexibility of terms and price relief from the last 36 months.

THE DETAILS
Due to the Inland Empire’s affordable and abundant land near Southern California’s Los Angeles and Long Beach ports, most national retailers have established warehouses and distribution centers in the area. Third-party logistics providers have expanded alongside them as e-commerce adoption accelerated. The twin ports process roughly a third of all U.S. imports, much of which is transported further inland via rail and highway. In this section, we aim to shine light on the nuances of the submarkets within the east and west regions of the Inland Empire. As you can see, rental rates tend to be higher as you move west, and lower towards the east and south end of the Inland Empire. What is consistent is that availability across all submarkets is increasing at a steady pace, and pricing has drastically adjusted downward accordingly over the last 12 months.

THE BIG PICTURE
The below table offers a snapshot of market average figures for the whole of the Inland Empire. The market was white-hot from 2020 to 2023 and only in the last 12 months have we seen things cool off. This trend mirrors what is happening on a national level. Tenants across the country leased record amounts of space over the last four years and are now downsizing their operations en masse. The result is the highest level of sublease inventory we’ve seen in decades. In the Inland Empire there is a total of 20.5 million square feet of sublease space on the market today—all of which is priced below market. These subleases are one of the primary factors driving pricing down, and availability up. This softening of the market fundamentals alongside the massive wave of subleases have created a massive optionality for tenants, and a very uncertain market for competing over-leveraged landlords on a direct basis.

THE BUZZ
REITS Trade Large Portfolio: Blackstone sold a $1B industrial portfolio to Rexford Industrial in Southern California. Rexford continues to be incredibly bullish on the local Los Angeles, Orange County and Inland Empire industrial markets, taking every opportunity to increase its market share locally.
Amazon is Expanding Again in the Inland Empire in 2024: The king of e-commerce has taken advantage of loosening market conditions to expand in the region with three new Class A industrial buildings totaling over three million square feet.
THE TREND
The true health of any market should be judged not by its vacancy rate, but it’s availability rate. In other words, we should worry less about what is currently, physically vacant, and more about what is coming to market shortly. Industrial availability in the Inland Empire has significantly increased from 3.7% in mid-2022 to 11.4% by the second quarter of 2024, surpassing the national average. This rise is largely due to a surge in new supply, with over 35 million square feet of industrial space completed since 2023, of which 34% remains available for lease. Tenant demand has contracted, exacerbated by large distribution center closures, and reduced inventories and imports. The increased new supply of deliverables coupled with the massive uptick in sublease inventory has softened the tenant demand and the new normal of downward price discovery ensues for the remainder of the year and beyond.

THE NEIGHBORS
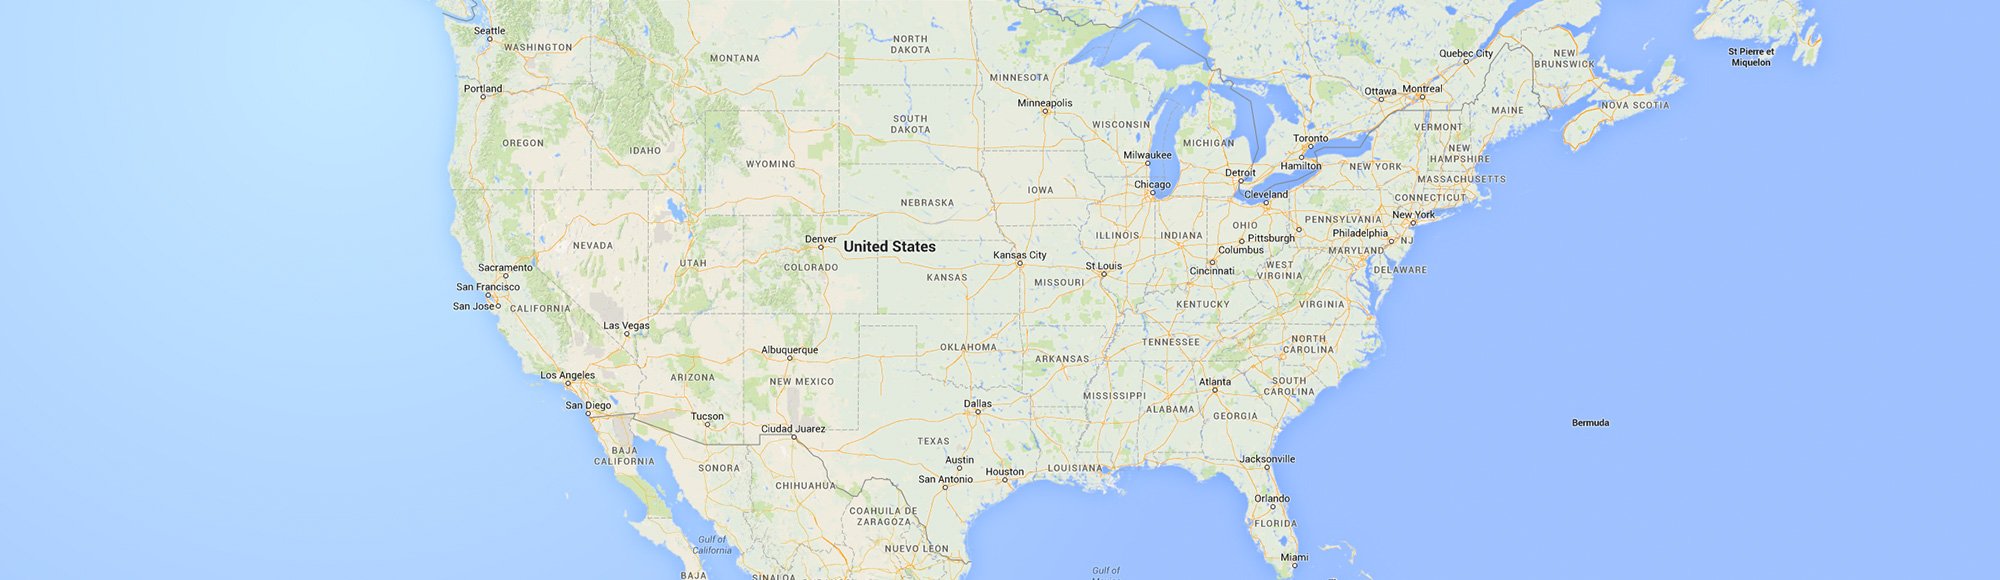
Southern California boasts some of the highest rental rates in the country. As a result, many companies that do not have an operational need to maintain a facility in the region have elected to relocate or expand out of state. Many major markets like Dallas, TX, or Raleigh, NC, can offer state-of-the-art properties at less than half the cost of Southern California. These real estate savings often outweigh any costs of relocating, but must also be measured against operational costs such as drayage, labor, taxes, etc. Below is a snapshot of average real estate pricing across the country.

Market statistics provided by CoStar Group.