THE DETAILS
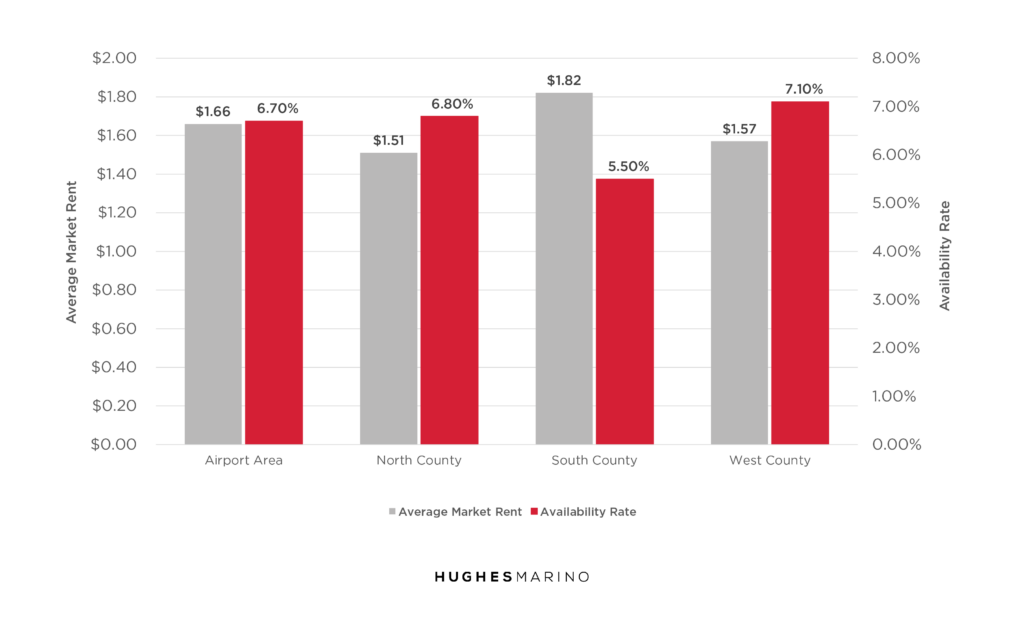
Looking at a single market report can be helpful, but without context it can be misleading as well. Each submarket, city, neighborhood and even building is uniquely positioned within the greater market. In this section we aim to shine light on the nuances of the four primary regions of Orange County. As you can see, rental rates tend to be higher as you move south, and lower towards the north end of Orange County. What is consistent is that availability across all submarkets is increasing at a steady pace, and pricing has started to adjust accordingly.

THE BIG PICTURE
The below table offers a snapshot of market average figures for the whole of Orange County. The market was white hot from 2020 to 2023, and only in the last 12 months have we seen things cool off. This trend mirrors what is happening on a national level. Tenants across the country leased record amounts of space over the last four years and are now downsizing their operations en masse. The result is the highest level of sublease inventory we’ve seen in decades. In Orange County there is a total of 4.2M square feet of sublease space on the market today—all of which is priced below market. These subleases are one of the primary factors driving pricing down, and availability up. This is the softening of the market in action.

THE BUZZ
- REITs Trade Large Portfolio: Blackstone sold a $1B industrial portfolio to Rexford Industrial in Southern California. Rexford continues to be incredibly bullish on the local Los Angeles, Orange County and Inland Empire industrial markets, taking every opportunity to increase its market share locally.
- Rexford Lowers Rent Growth Projection: 3100 S Harbor in Santa Ana was once a 200,000 square foot Class B office building, but is now being redeveloped into a 163,000 square foot industrial facility. Although the industrial market continues to soften this year, it is still much stronger than the flailing office market.
THE TREND
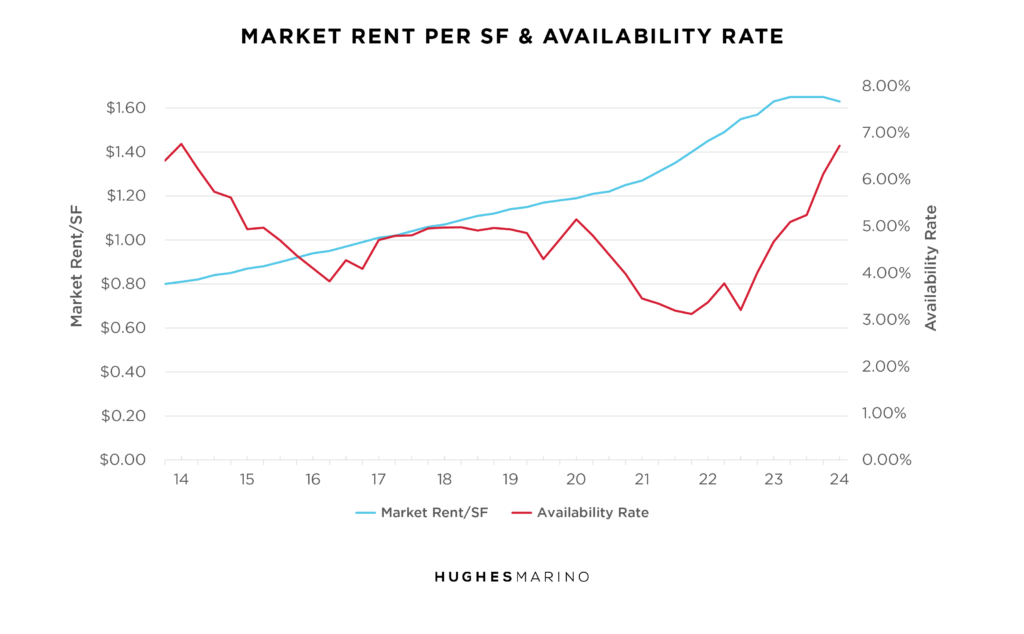
The true health of any market should be judged not by its vacancy rate, but it’s availability rate. In other words, we should worry less about what is currently, physically vacant, and more about what is coming to market in the near future. For years the trendline for availability was down and to the right as the market continued to tighten, but we are finally seeing availability increase. As demand increased in 2020–2023, developers ran to build as much industrial space as possible to fill the need. Now demand has pulled back, but supply continues to flood the market. Not only is there an additional 1.8M square feet under construction, but there is over 4.2M square feet of sublease inventory available as well. Last year showed us the first signs of a softening market and, today, it is clear that the party is over for industrial landlords.

THE NEIGHBORS
Southern California boasts some of the highest rental rates in the country. As a result, many companies that do not have an operational need to maintain a facility in the region have elected to relocate or expand out of state. Many major markets like Dallas, TX, or Raleigh, NC, can offer state-of-the-art properties at less than half the cost of Southern California. These real estate savings often outweigh any costs of relocating, but must also be measured against operational costs such as drayage, labor, taxes, etc. Above is a snapshot of average real estate pricing across the country.
Marketing statistics provided by CoStar Group.


